Problem
MicroRNAs are tiny regulatory molecules (about 22 nucleotides) that play an outsized role in controlling gene expression. In aging research, understanding which miRNAs are differentially expressed and how they interact in regulatory networks reveals the molecular mechanisms behind age-related changes. Turning raw sequencing data into biological insight requires a multi-step computational pipeline, and each statistical decision can dramatically affect the final results.
The challenge isn't just running the analyses. It's building a pipeline where statistical methods match the data characteristics (miRNA-seq behaves differently than mRNA-seq), where results are reproducible, and where network analysis captures genuine biological relationships rather than statistical artifacts. False positives in network analysis are particularly problematic because they lead researchers down expensive experimental dead ends.
This work contributed to published findings on miRNA regulatory networks in aging, demonstrating how computational analysis can guide experimental biology.
Approach
I built a comprehensive R-based bioinformatics pipeline that takes raw miRNA sequencing count data through normalization, differential expression analysis, and network construction. The pipeline integrates four major analysis frameworks: DESeq2 for normalization and differential expression, limma for linear modeling, WGCNA for weighted co-expression network analysis, and Cytoscape for network visualization and export.
The pipeline was designed for reproducibility from the start. Every analysis step logs its parameters, input data dimensions, and output statistics. The R scripts use explicit random seeds, versioned library calls, and checkpointing so that any intermediate step can be re-run independently. This was non-negotiable for published research where reviewers need to verify your analysis.
The network analysis phase uses WGCNA's soft-thresholding approach, which preserves the continuous nature of co-expression relationships rather than imposing arbitrary cutoffs. This produces more biologically meaningful module assignments, though it requires careful parameter selection (the soft-thresholding power) guided by scale-free topology criteria.
Architecture
Raw miRNA-seq data enters the pipeline and passes through DESeq2 for normalization and initial differential expression testing. The normalized expression matrix then feeds two parallel analysis tracks: limma for refined statistical modeling with more complex experimental designs, and WGCNA for identifying co-expression modules and hub miRNAs. Results from both tracks converge in Cytoscape for network visualization and publication-ready figure generation.
Key Technical Details
DESeq2 normalization accounts for the compositional nature of sequencing data. miRNA-seq libraries have a few highly abundant species that can distort raw count comparisons between samples. The variance-stabilizing transformation (VST) produces a matrix suitable for downstream network analysis:
dds <- DESeqDataSetFromMatrix(
  countData = count_matrix,
  colData = sample_info,
  design = ~ condition + age_group
)

dds <- DESeq(dds)
vst_data <- varianceStabilizingTransformation(dds, blind = FALSE)

# Differential expression results
res <- results(dds, contrast = c("condition", "aged", "young"),
               alpha = 0.05, lfcThreshold = 0.5)
The WGCNA soft-thresholding power selection is one of the most critical decisions in the pipeline. The power parameter controls how aggressively weak correlations are suppressed. I used the scale-free topology fit index, targeting R-squared above 0.85 while keeping mean connectivity reasonable:
powers <- c(1:20)
sft <- pickSoftThreshold(
  vst_matrix,
  powerVector = powers,
  networkType = "signed",
  verbose = 5
)

# Select power where scale-free R^2 > 0.85
selected_power <- sft$powerEstimate
Using a signed network (rather than unsigned) was a deliberate choice. In biology, the direction of co-expression matters: miRNAs that are positively correlated are likely co-regulated, while negative correlations suggest antagonistic regulatory roles. Signed networks preserve this distinction, producing modules that are more biologically coherent.
Multiple testing correction uses the Benjamini-Hochberg procedure throughout the pipeline. With thousands of miRNAs being tested simultaneously, controlling the false discovery rate is essential. I applied a consistent FDR threshold of 0.05 across all statistical tests, with additional log-fold-change thresholds to focus on biologically meaningful changes rather than statistically significant but tiny effects.
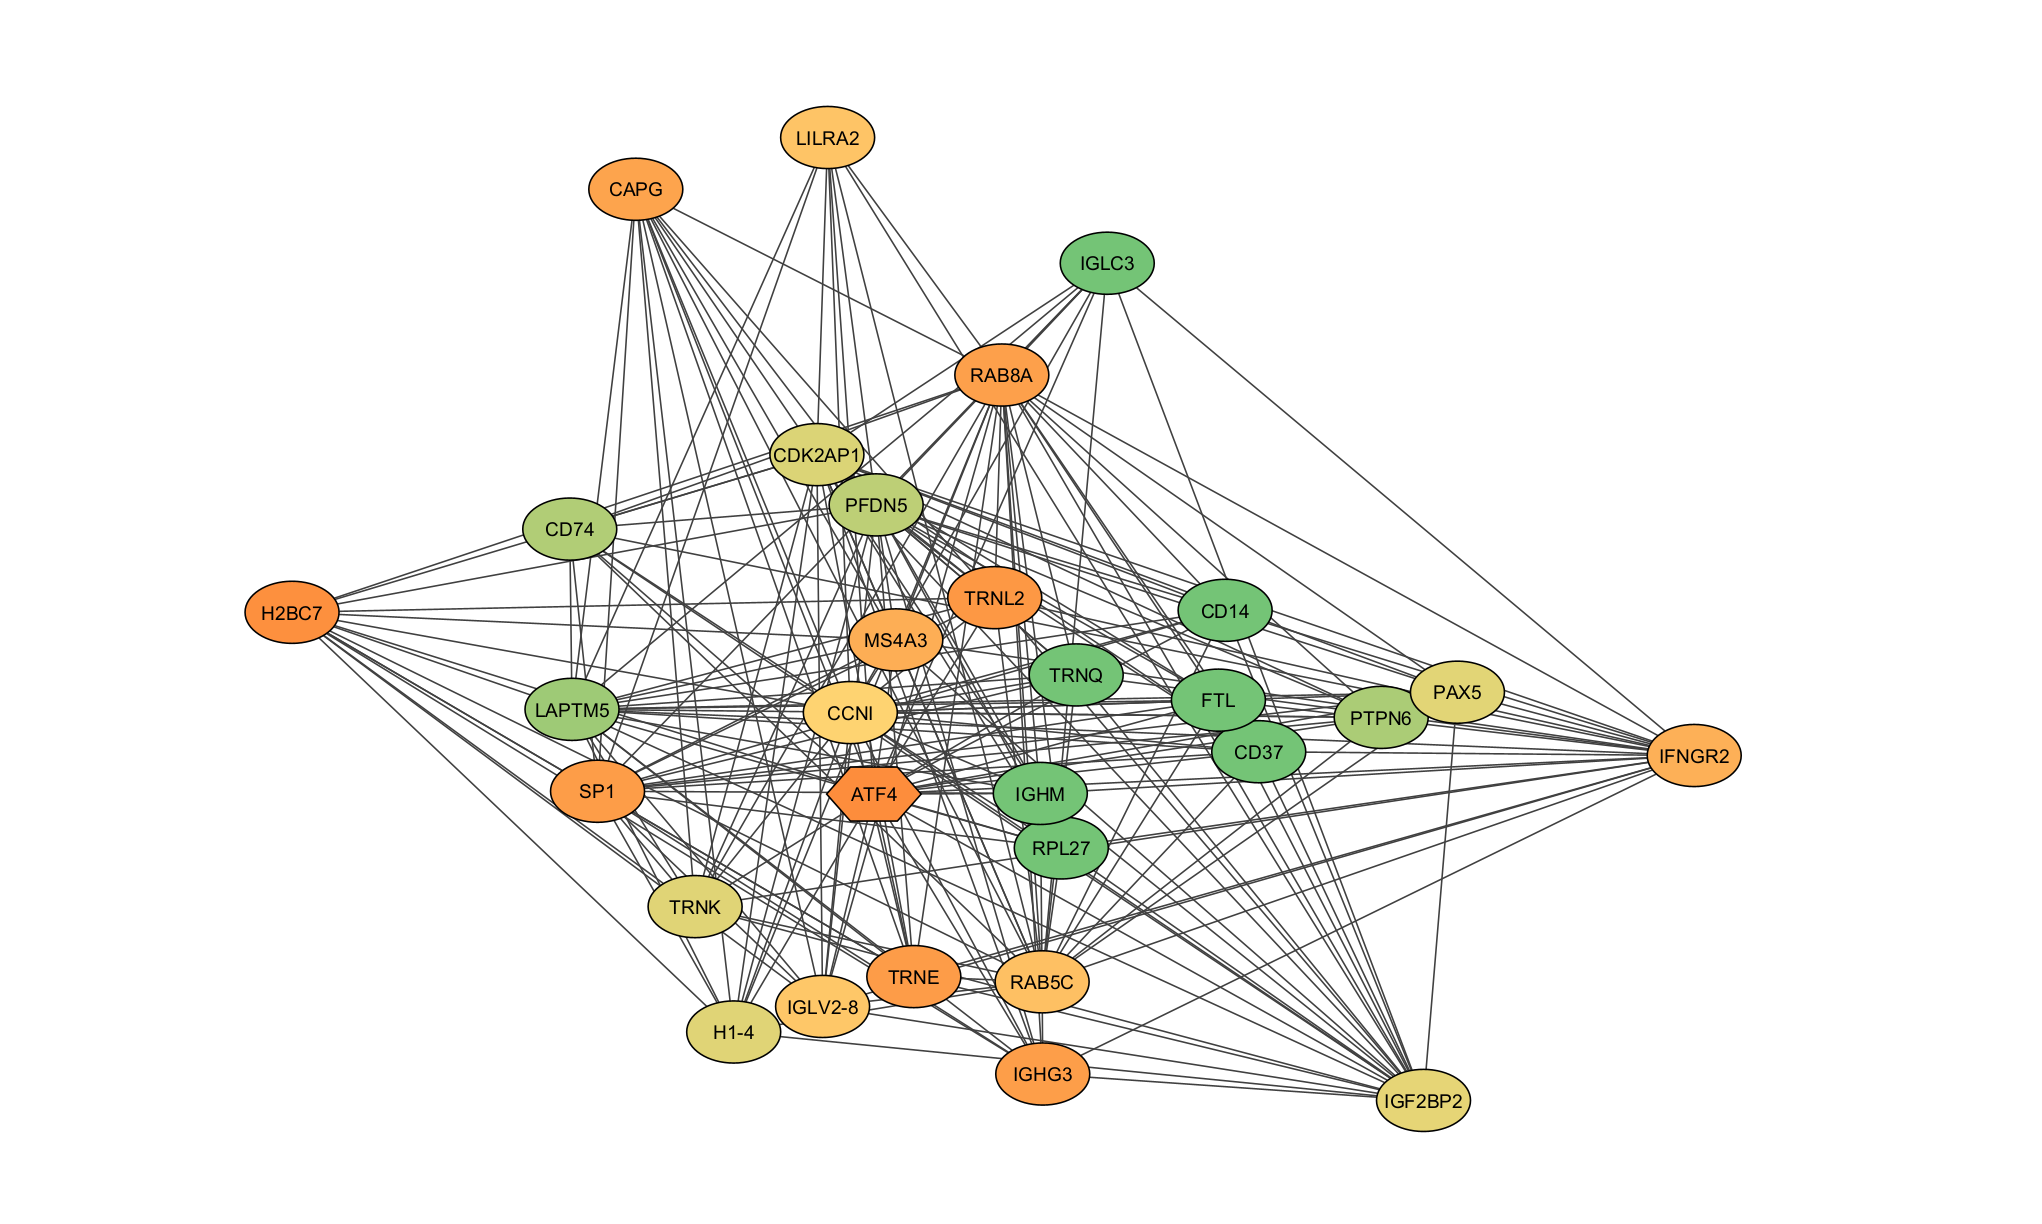
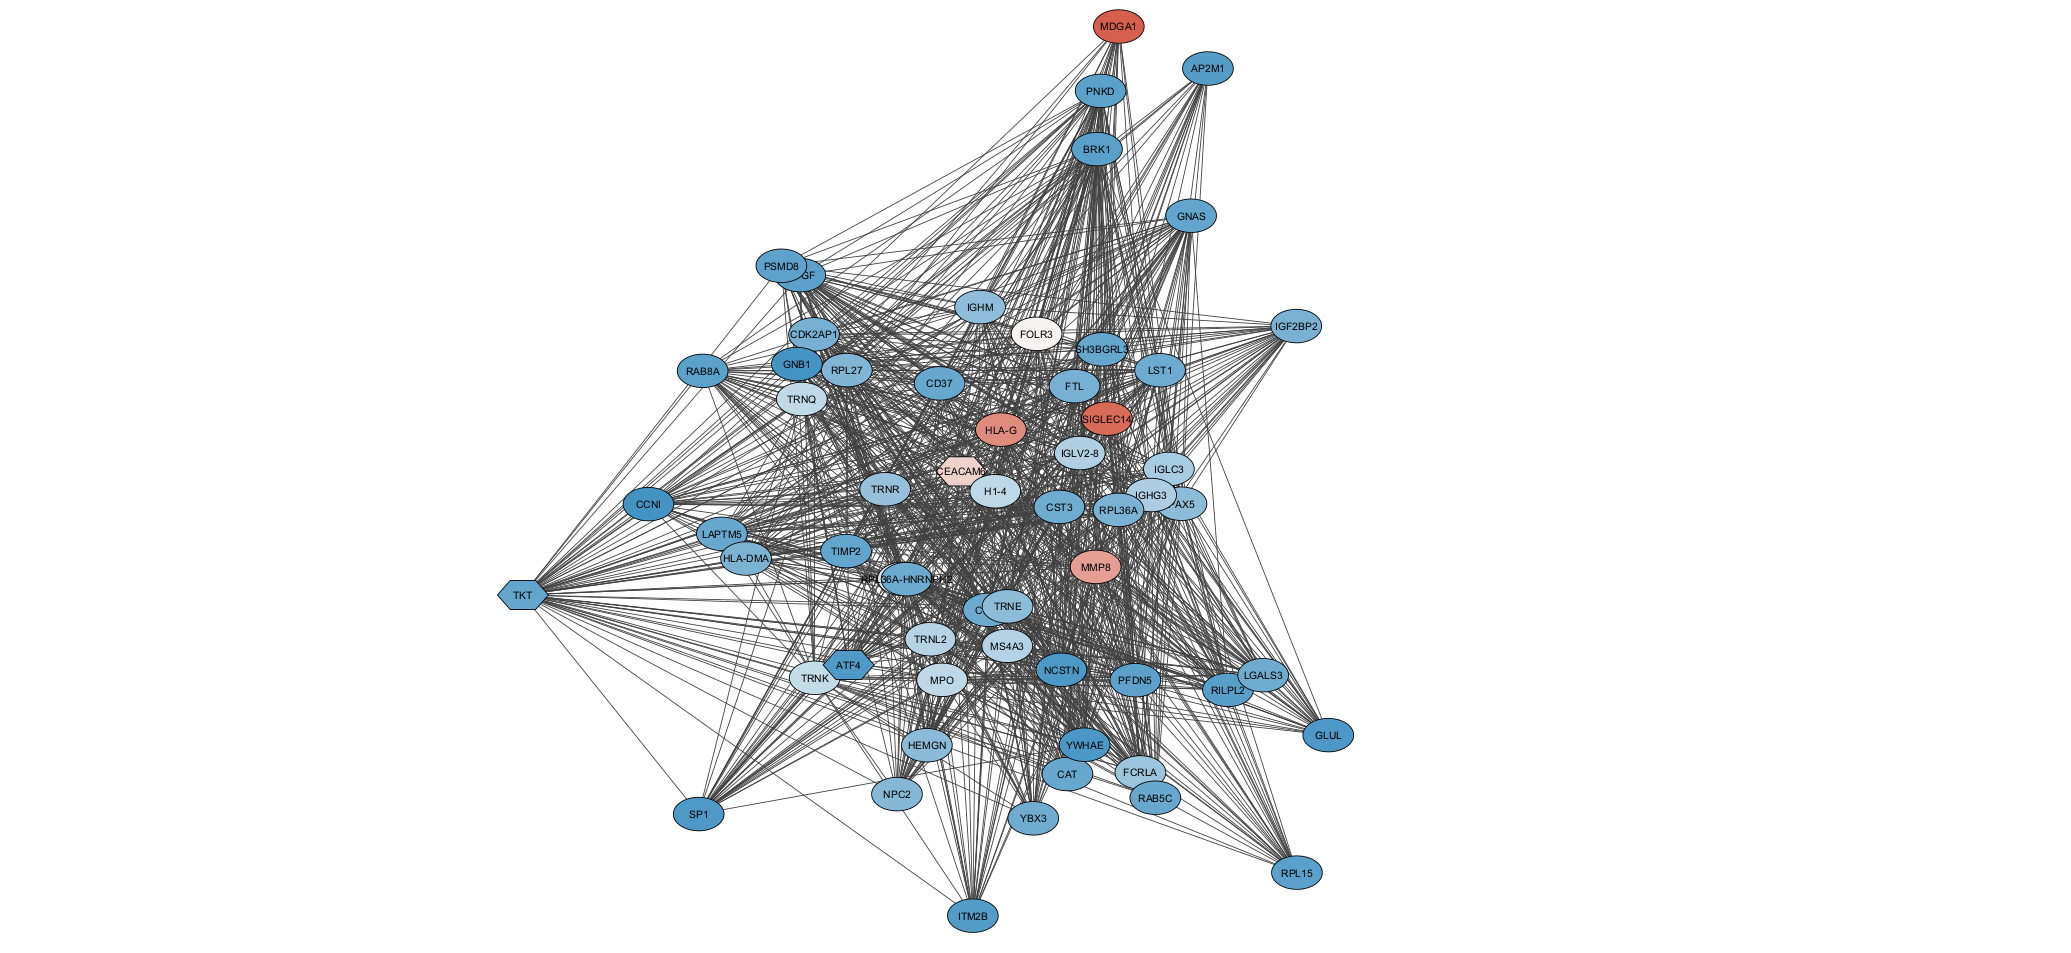
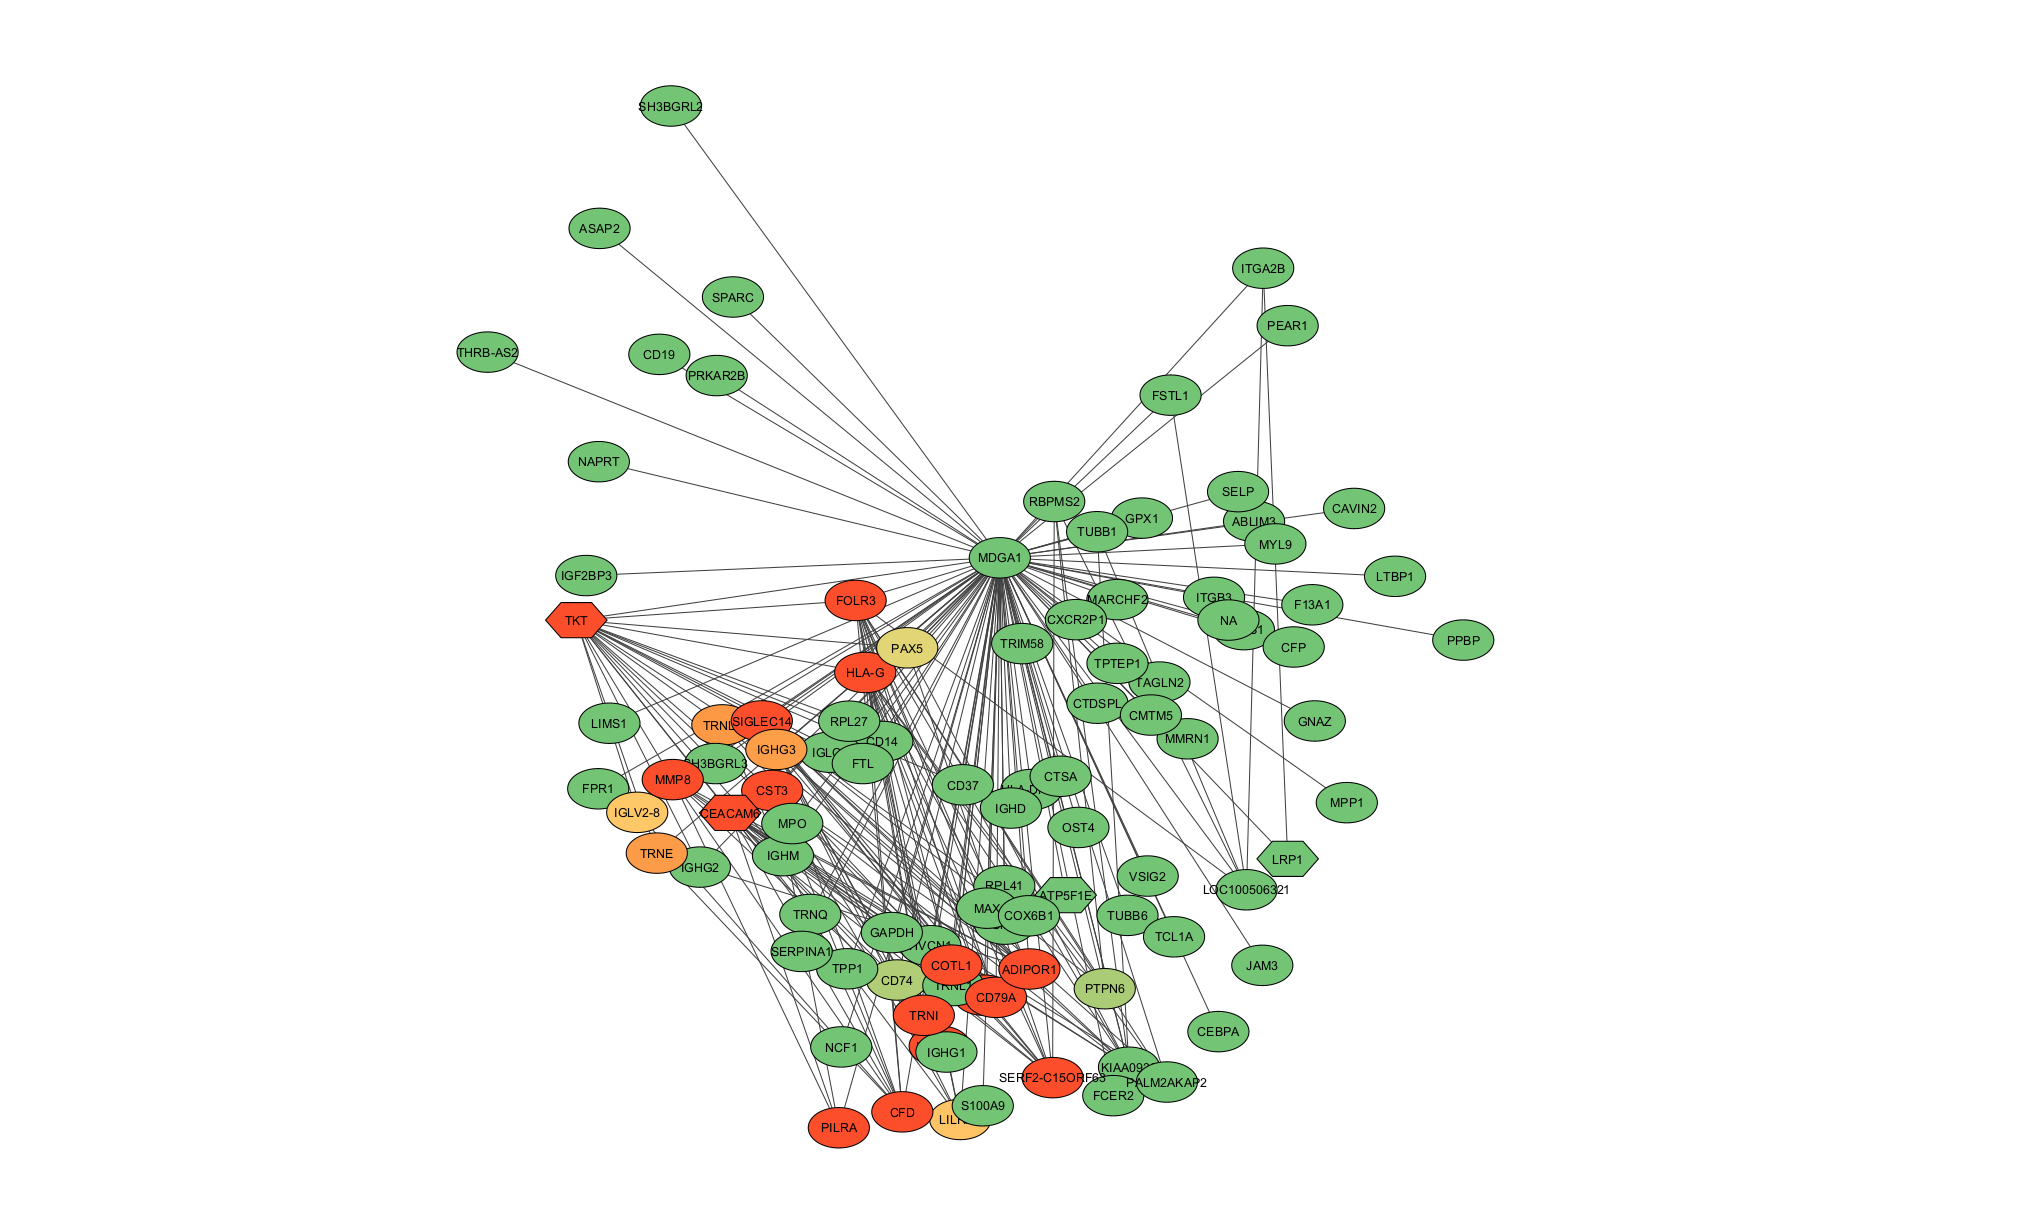
The final network visualization exports from R to Cytoscape using the RCy3 interface, which allows programmatic control over layout, styling, and annotation. Hub miRNAs (those with high intra-module connectivity) are highlighted automatically, making it easy to identify the most influential regulators in each module.
What moved, what constrained it, and what trade-offs stayed visible.
Operational outcome, the limits around it, and the practical decisions that shaped the work.
Identified novel miRNA co-expression modules associated with aging. Findings submitted to peer-reviewed journals, contributing to understanding of age-related regulatory mechanisms.
Sample size limitations inherent to miRNA-seq experiments. Computational cost of network construction scales quadratically with the number of miRNAs. Biological validation of computational predictions requires wet-lab experiments.
Soft thresholding over hard cutoffs in WGCNA for biological fidelity, at the cost of more complex parameter selection. Signed networks over unsigned for directional information, requiring larger sample sizes for stable module detection. Conservative FDR thresholds to minimize false positives, accepting some false negatives.