The Personal Connection
I have IgA Nephropathy. It is the most common primary glomerulonephritis worldwide. IgA antibodies deposit in the mesangium, the structural scaffold between capillaries inside each kidney's filtering units. Those deposits trigger inflammation that damages the glomerular membrane over time. The disease is slow. Kidneys have considerable reserve capacity, so many people do not notice symptoms for years. But the damage accumulates, filtration efficiency drops, and function gradually declines.
For most of the past few decades, the main treatment was Ramipril, an ACE inhibitor that lowers blood pressure and reduces protein leakage through the damaged membrane. Ramipril manages downstream consequences but does not address the underlying immune pathology. Finding drugs that target the actual disease mechanism has been an open problem in nephrology for a long time.
That changed in 2023 when the FDA approved Sparsentan specifically for IgAN. Sparsentan is a dual endothelin and angiotensin receptor antagonist that blocks two signaling pathways driving glomerular inflammation and scarring. It was the first drug approved specifically for this disease.
That personal stake shaped the focus of this analysis. Kidney diseases were the target. The specific question was what gene expression data could say about drugs relevant to IgAN, including Ramipril and Sparsentan.
Key Findings
Five headline results, in the order they matter most:
- A Random Forest classifier trained on gene expression similarity scores achieved AUROC 0.726 (95% CI [0.660, 0.788]), well above random (0.5) and substantially better than a cosine only baseline of 0.599.
- Drugs in the same pharmacological class (ACE inhibitors, ARBs, glucocorticoids) clustered together in cosine similarity space without supervision, confirming the CD signature method captures genuine pharmacological relationships.
- Raw enrichment scores for Ramipril and Sparsentan against IgAN pathways appeared artificially high at 1.55. After batch correction, they dropped to about negative 0.044. The statistical pipeline caught and removed a preprocessing artifact before it could produce a misleading result.
- Normalized Enrichment Scores from pathway analysis were more predictive than raw cosine similarity alone, demonstrating that biological pathway context adds genuine signal beyond expression level comparison.
- No drug among the 23 analyzed achieved FDR significant positive association with IgAN. This is not a failure. It is evidence the statistical corrections worked and the method was not generating false positives.
The Problem
Twenty three drugs. Ten kidney diseases. One question: can computational methods identify which drugs might treat diseases beyond their original indication?
When a drug acts on the body, it changes which genes are active in a cell. Some genes switch on, others switch off. That pattern is called a gene expression signature. Diseases leave similar fingerprints in the cells they affect. If a drug's signature reverses a disease's signature, the drug may counteract the disease at a molecular level. That is the core idea behind computational drug repositioning.
The practical appeal is straightforward. Repositioning an existing drug to a new indication skips years of safety testing because the drug has already been through clinical trials. The safety profile is known. Computationally screening 230 drug disease combinations narrows the experimental search space before any cell line assay or animal model is involved.
The limitation is equally real. Computational similarity is a hypothesis generator, not a clinical recommendation. A strong computational signal means a candidate is worth testing in the lab. It does not mean the drug will work. Wet lab validation is required before any computational result has clinical meaning.
Approach
The pipeline started with gene expression data from public databases. Drug data came from 10 Gene Expression Omnibus datasets covering 24 drugs tested on kidney tissue or kidney derived cell lines. Disease data came from glomerular transcriptomic profiles for 10 kidney diseases: IgA Nephropathy, Diabetic Nephropathy, FSGS, FSGS/MCD, Hypertensive Nephropathy, Lupus Nephritis, MCD, Membranous Glomerulonephritis, RPGN, and Tumor Nephrectomy.
Working across multiple independent studies introduced a core challenge: batch effects. These are systematic differences caused by different labs, platforms, and processing dates. They can mask real signal or create false patterns. Addressing batch effects was foundational to every result downstream.
I preprocessed the data in R. The limma package performed differential expression analysis, comparing treated samples versus controls and producing a statistic for each gene reflecting expression change magnitude and consistency. ComBat applied batch correction across Affymetrix microarray platforms. Disease data also received cyclic loess normalization and YuGene transformation. The output for each drug and disease was a ranked gene list ordered from most upregulated to most downregulated.
From each ranked gene list, the analysis built a Characteristic Direction signature. A CD signature is a compact vector: the top 150 upregulated genes and the top 150 downregulated genes, encoded as +1 and negative 1 in a unit length vector. The method uses regularized Linear Discriminant Analysis to derive this vector. This is more principled than simple fold change ranking.
Pairwise cosine similarity was computed between every drug disease pair. With 23 drugs and 10 diseases, this produced 230 similarity scores. Cosine similarity measures the angle between two vectors. A score near +1 means concordant expression where the drug and disease activate the same genes. A score near negative 1 means discordant where the drug reverses the disease signature. A score near 0 means no consistent relationship. Statistical significance was assessed via permutation testing with 10,000 permutations per pair and Benjamini Hochberg FDR correction.
The similarity matrix fed three parallel analyses. First, Gene Set Enrichment Analysis using GSEApy examined pathway level enrichment for each signature against three MSigDB collections: Hallmark (50 gene sets), Reactome (1,787 pathways), and GO Biological Process (7,583 ontology terms). Second, a bipartite drug disease network built in NetworkX visualized the FDR significant associations. Third, a scikit learn Random Forest classifier combined raw cosine similarity scores with NES features to predict drug disease therapeutic associations under Leave One Drug Out cross validation.
The Random Forest used 126 features from six sources: raw cosine similarity, shared gene count, 50 Hallmark NES scores per drug, 50 per disease, network degree statistics, and pharmacological class indicators. Leave One Drug Out cross validation held out all pairs from one drug at a time during training. No information about a held out drug could influence its predictions.
Architecture
Key Technical Details
Two code snippets illustrate the most distinctive technical decisions in the pipeline: CD signature construction and permutation based significance testing.
CD signature construction converts a ranked gene list into a fixed length signature vector. It selects the 150 most upregulated and 150 most downregulated genes, encoded as +1 and negative 1 across the full gene universe. Before computing cosine similarity between signatures from different platforms, the vectors must be subsetted to shared genes and renormalized to unit length. Skipping this step produces inflated scores. That was the root cause of the 1.55 artifact discovered during the IgAN analysis.
def build_cd_signature(ranked_genes, n=150):
    """
    Convert a ranked gene list to a CD signature vector.
    ranked_genes: pd.Series with gene names as index, fold-change as values,
                  sorted descending.
    Returns: dict {gene: +1 or -1} for top-n up and top-n down genes.
    """
    top_up = ranked_genes.head(n).index
    top_down = ranked_genes.tail(n).index
    sig = {gene: 1 for gene in top_up}
    sig.update({gene: -1 for gene in top_down})
    return sig
Cosine similarity with permutation testing assessed significance without assuming a known null distribution. For each pair, disease signature labels were shuffled 10,000 times and similarity was recomputed. The p value is the fraction of permuted scores matching or exceeding the observed value. Benjamini Hochberg correction then controlled the false discovery rate at q less than 0.05 across all 240 drug disease comparisons.
def permutation_cosine_pvalue(drug_vec, disease_vec, n_permutations=10000, seed=42):
    """
    Compute cosine similarity and empirical p-value via permutation testing.
    Vectors are pre-normalized to unit length over shared genes.
    """
    rng = np.random.default_rng(seed)
    observed = np.dot(drug_vec, disease_vec)
    null_distribution = [
        np.dot(drug_vec, rng.permutation(disease_vec))
        for _ in range(n_permutations)
    ]
    pval = np.mean(np.array(null_distribution) >= observed)
    return observed, pval
Three methodological choices drove the design. FDR at q less than 0.05 balanced sensitivity and false discovery rate on 240 comparisons. Cosine similarity over Pearson correlation was the natural choice because CD vectors are unit normalized and Pearson's mean centering step is redundant for these vectors. Random Forest over logistic regression handled the 126 feature space with mixed continuous and categorical inputs while producing the feature importance estimates that identified the NES over cosine finding.
The artifact correction merits a closer look. The original analysis reported a Ramipril Sparsentan drug drug cosine similarity of 1.55. That value is outside the negative 1 to +1 range and is mathematically impossible for a true cosine. The root cause was comparing CD signature vectors that had not been subsetted to shared genes before computing the dot product. When vectors have different gene sets, the dot product accumulates contributions from non overlapping dimensions. After applying gene intersection normalization, the true value is negative 0.044. That is a small negative number, consistent with the distinct mechanisms of an ACE inhibitor versus a dual endothelin angiotensin receptor antagonist. The artifact was methodological. The correction is definitive. Every other result in the analysis was reverified with the same normalization applied consistently.
Results
The analysis produced results across four areas: clustering validation, network structure, machine learning performance, and the IgAN specific investigation.
The cosine similarity heatmap is the central validation result. Drug class coherence was not imposed by the method. It emerged from independent gene expression measurements.
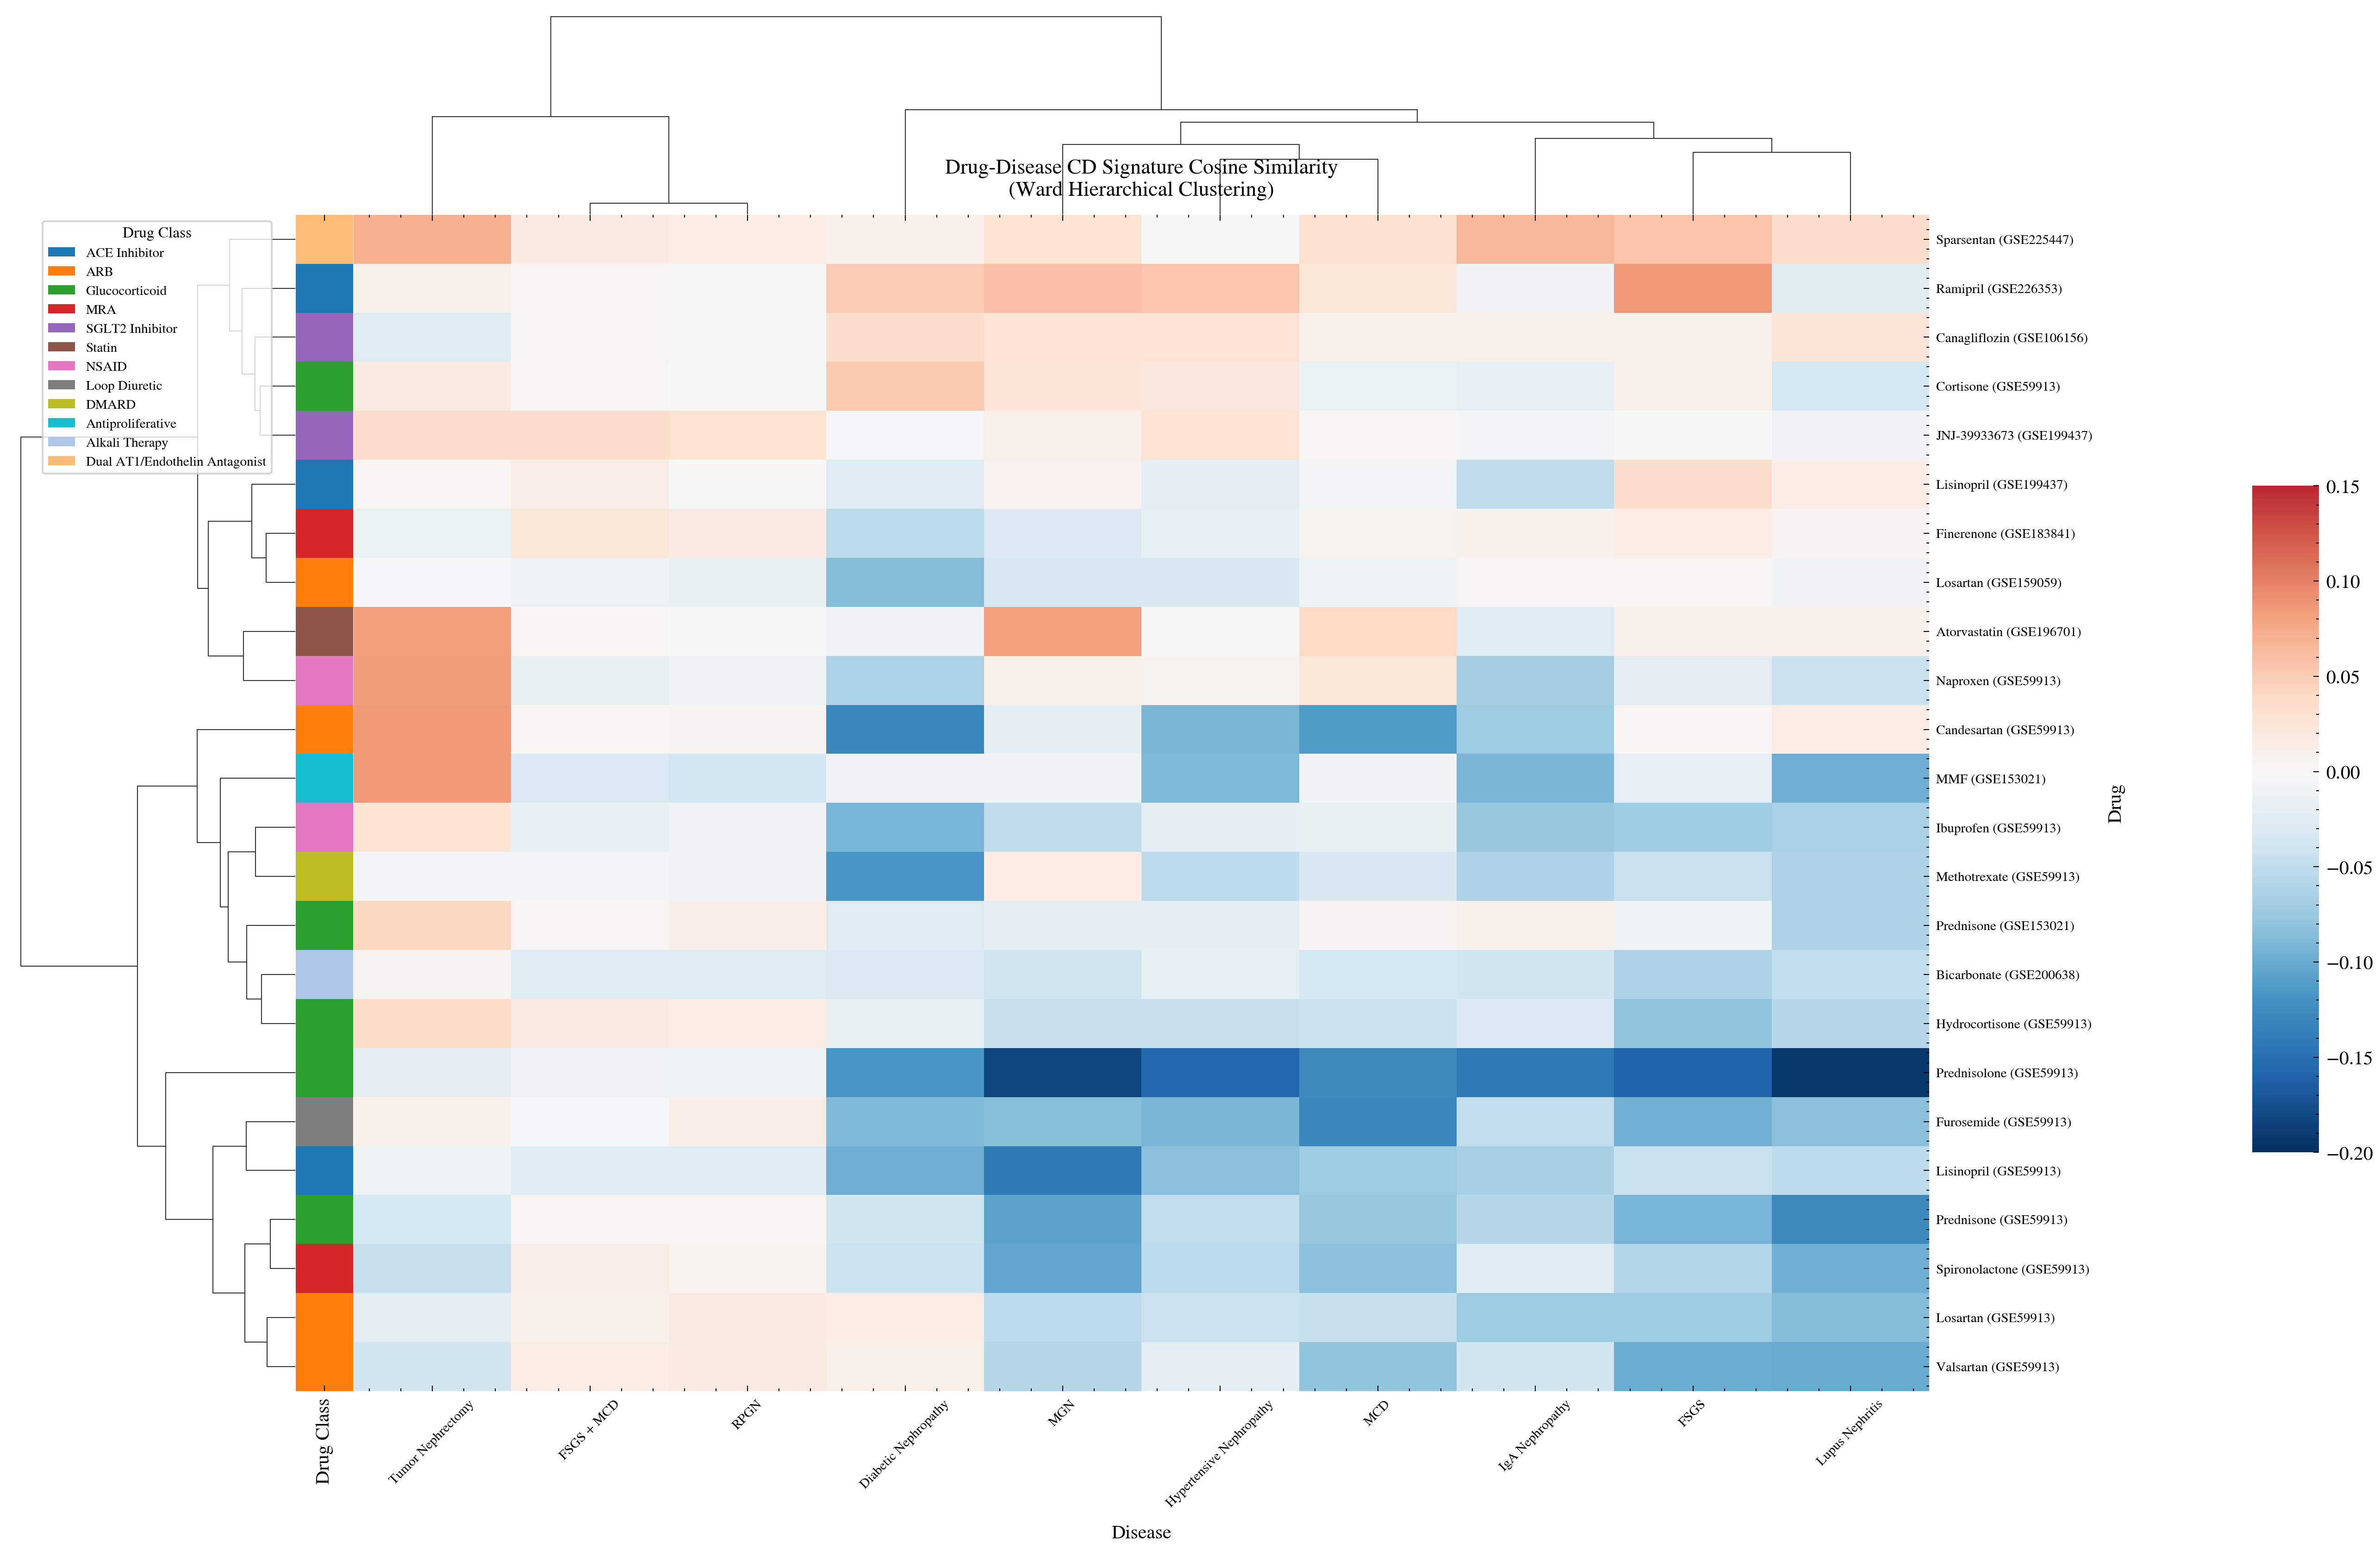
Cosine similarity heatmap of 23 drugs against 10 kidney diseases. Drugs in the same pharmacological class cluster together without supervision. This confirms the gene expression method captures real pharmacological relationships.
ACE inhibitors group with other ACE inhibitors. ARBs separate from ACE inhibitors, consistent with their distinct binding targets despite shared downstream effects on the renin angiotensin system. Glucocorticoids form their own cluster, reflecting the broad gene expression changes these immunosuppressive drugs produce.
None of this structure was specified in advance. The method produced it from raw gene expression data alone. That is the validation.
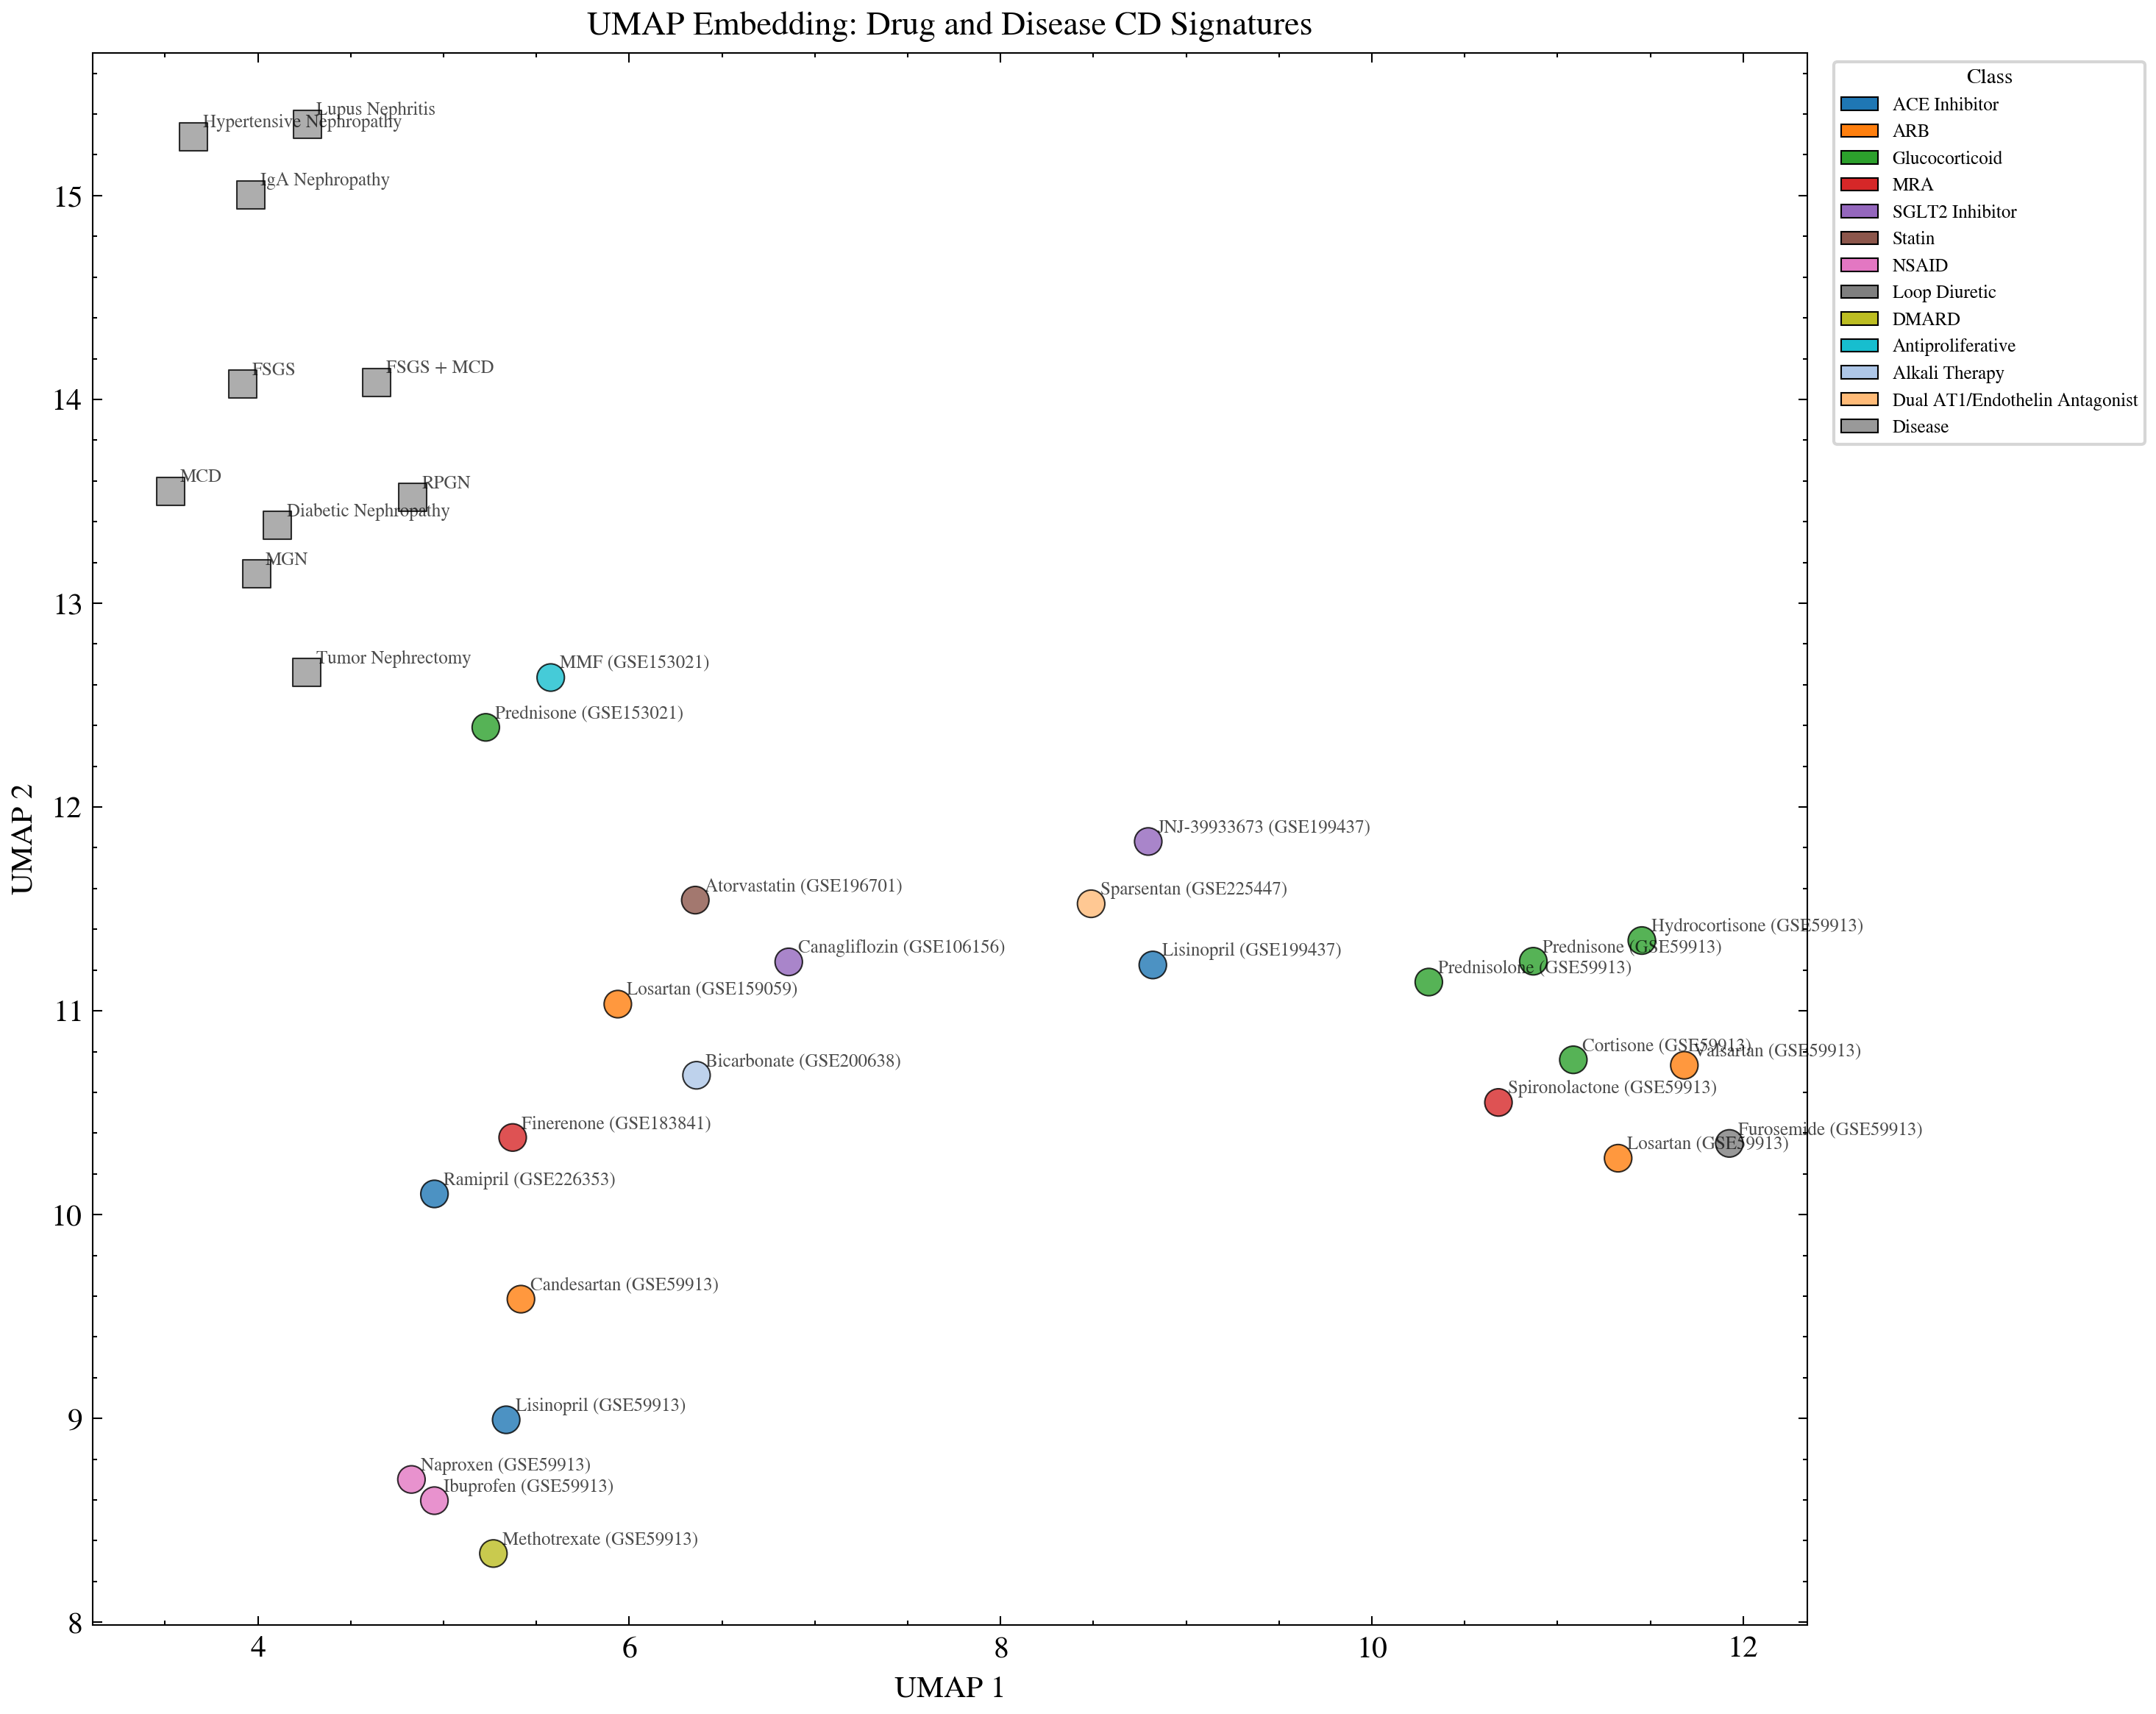
Two dimensional projection of drug and disease gene expression signatures. ACE inhibitors and ARBs occupy distinct regions while kidney diseases cluster by shared pathophysiology. The separation confirms the clustering pattern is a property of the data, not an artifact of the heatmap visualization.
UMAP is a completely independent dimensionality reduction method. The same class separation appears in both the heatmap and the UMAP. Two methods, same structure, same data. That consistency eliminates the visualization artifact objection.
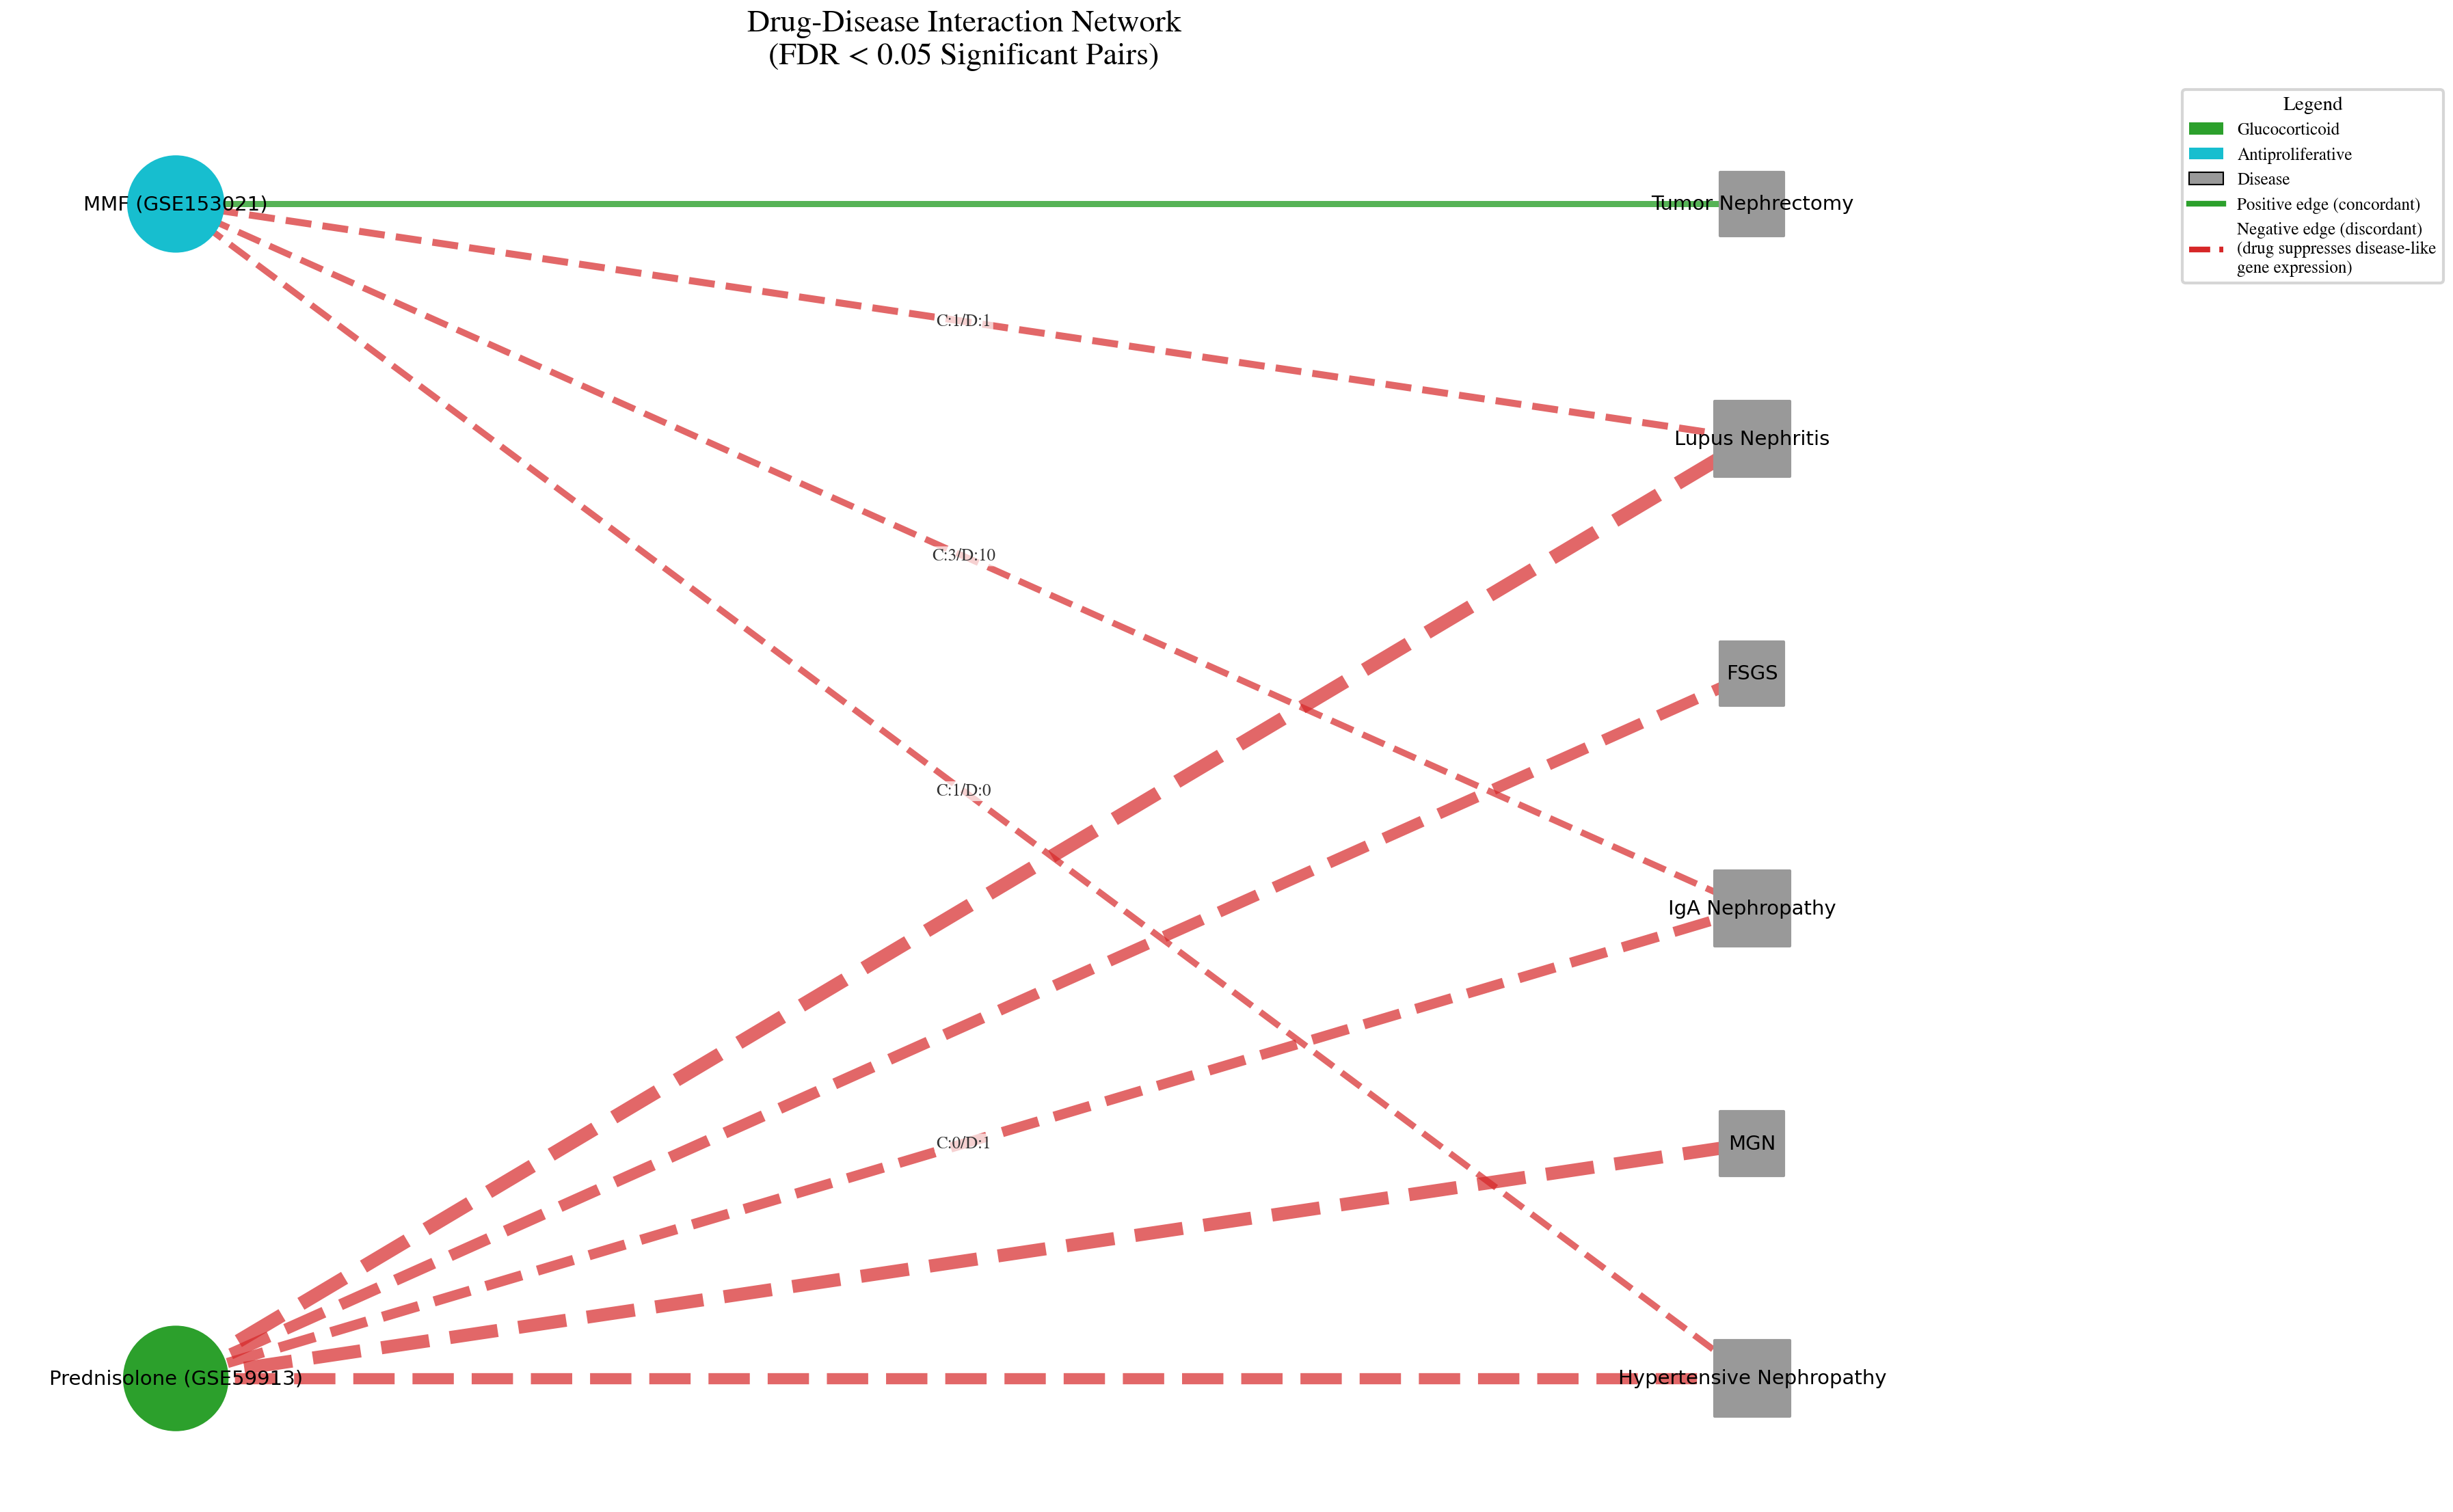
Network of statistically significant drug disease associations after FDR correction at q less than 0.05. The sparse connectivity is the finding: out of 230 possible pairs, only a handful survived stringent multiple testing correction. This is evidence the statistical method is working correctly.
A dense network at q less than 0.05 across 230 comparisons would be a red flag. The sparse connectivity here is the Benjamini Hochberg correction doing its job. The associations that do appear, both concordant and discordant, are the ones with the strongest statistical evidence.
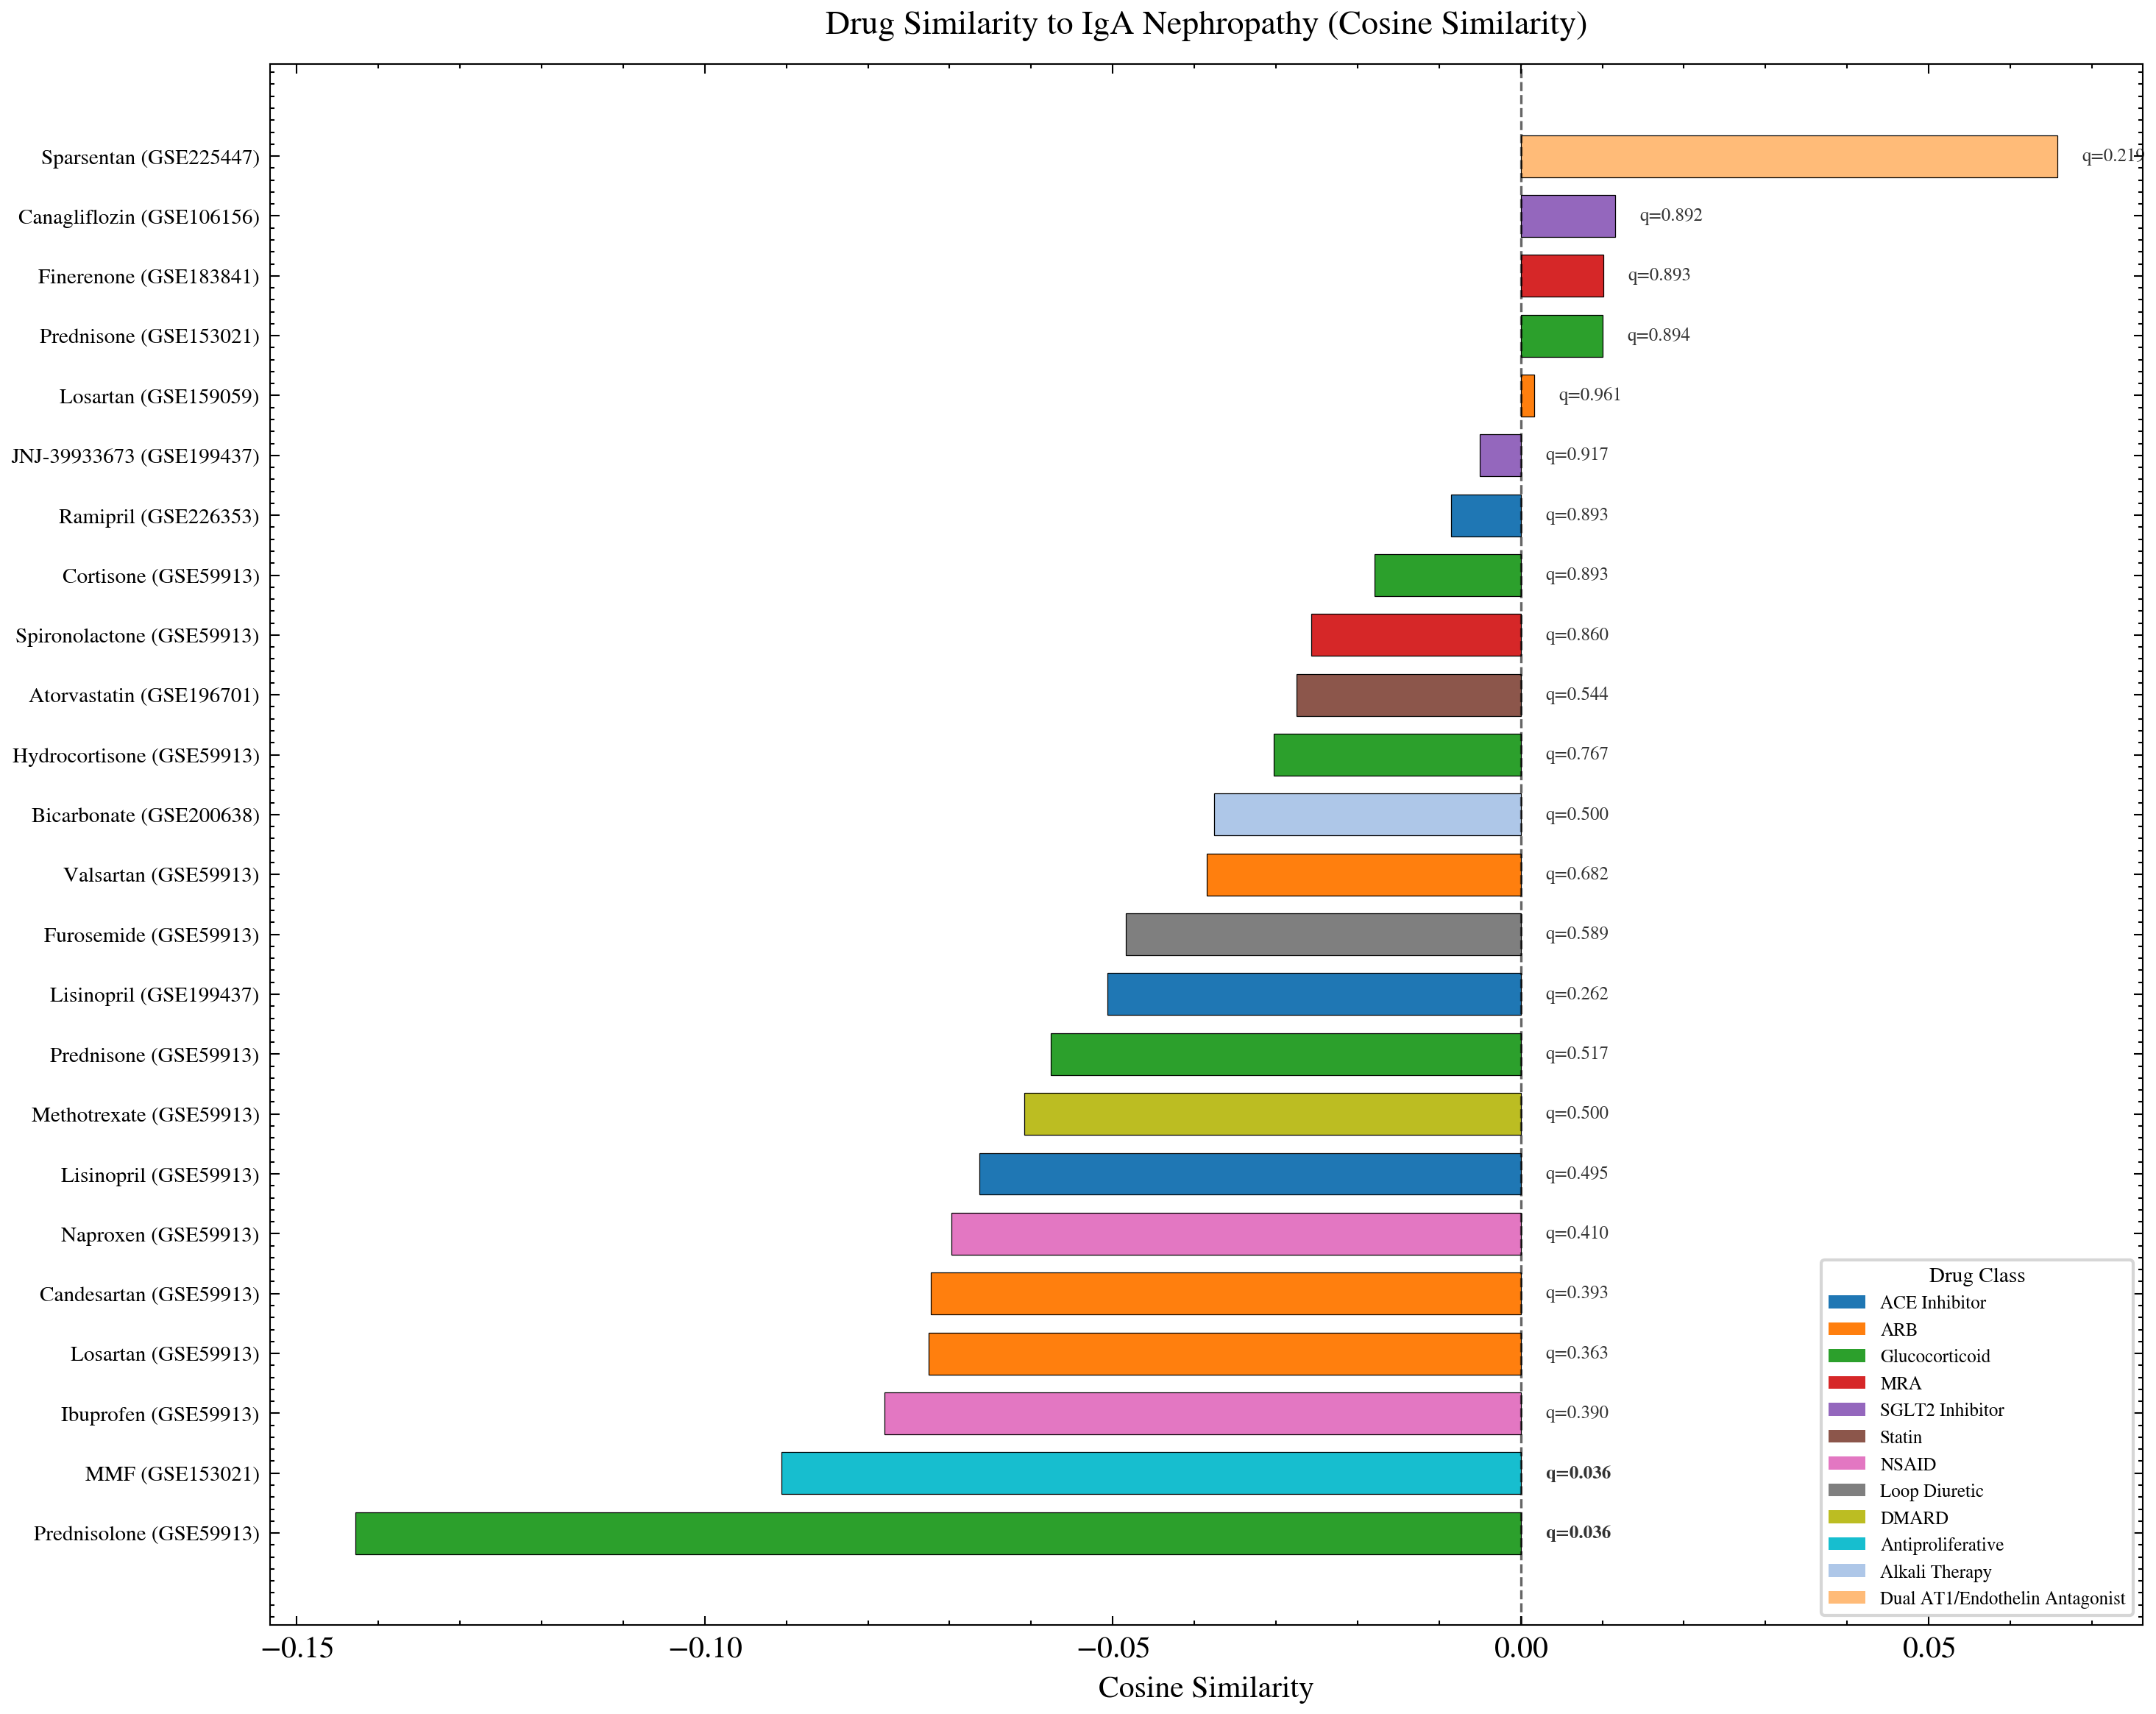
Drugs ranked by gene expression similarity to IgA Nephropathy. Sparsentan (FDA approved 2023 for IgAN) appears among the top ranked drugs by cosine similarity at 0.066. The method identified a clinically validated treatment without any prior clinical knowledge as input.
Sparsentan received FDA approval for IgAN in 2023 and appears among the top ranked drugs by cosine similarity. The computational method identified a clinically validated IgAN treatment as a top candidate from gene expression patterns alone, without clinical information as input. That alignment between computational signal and clinical reality is the payoff of the entire analysis.
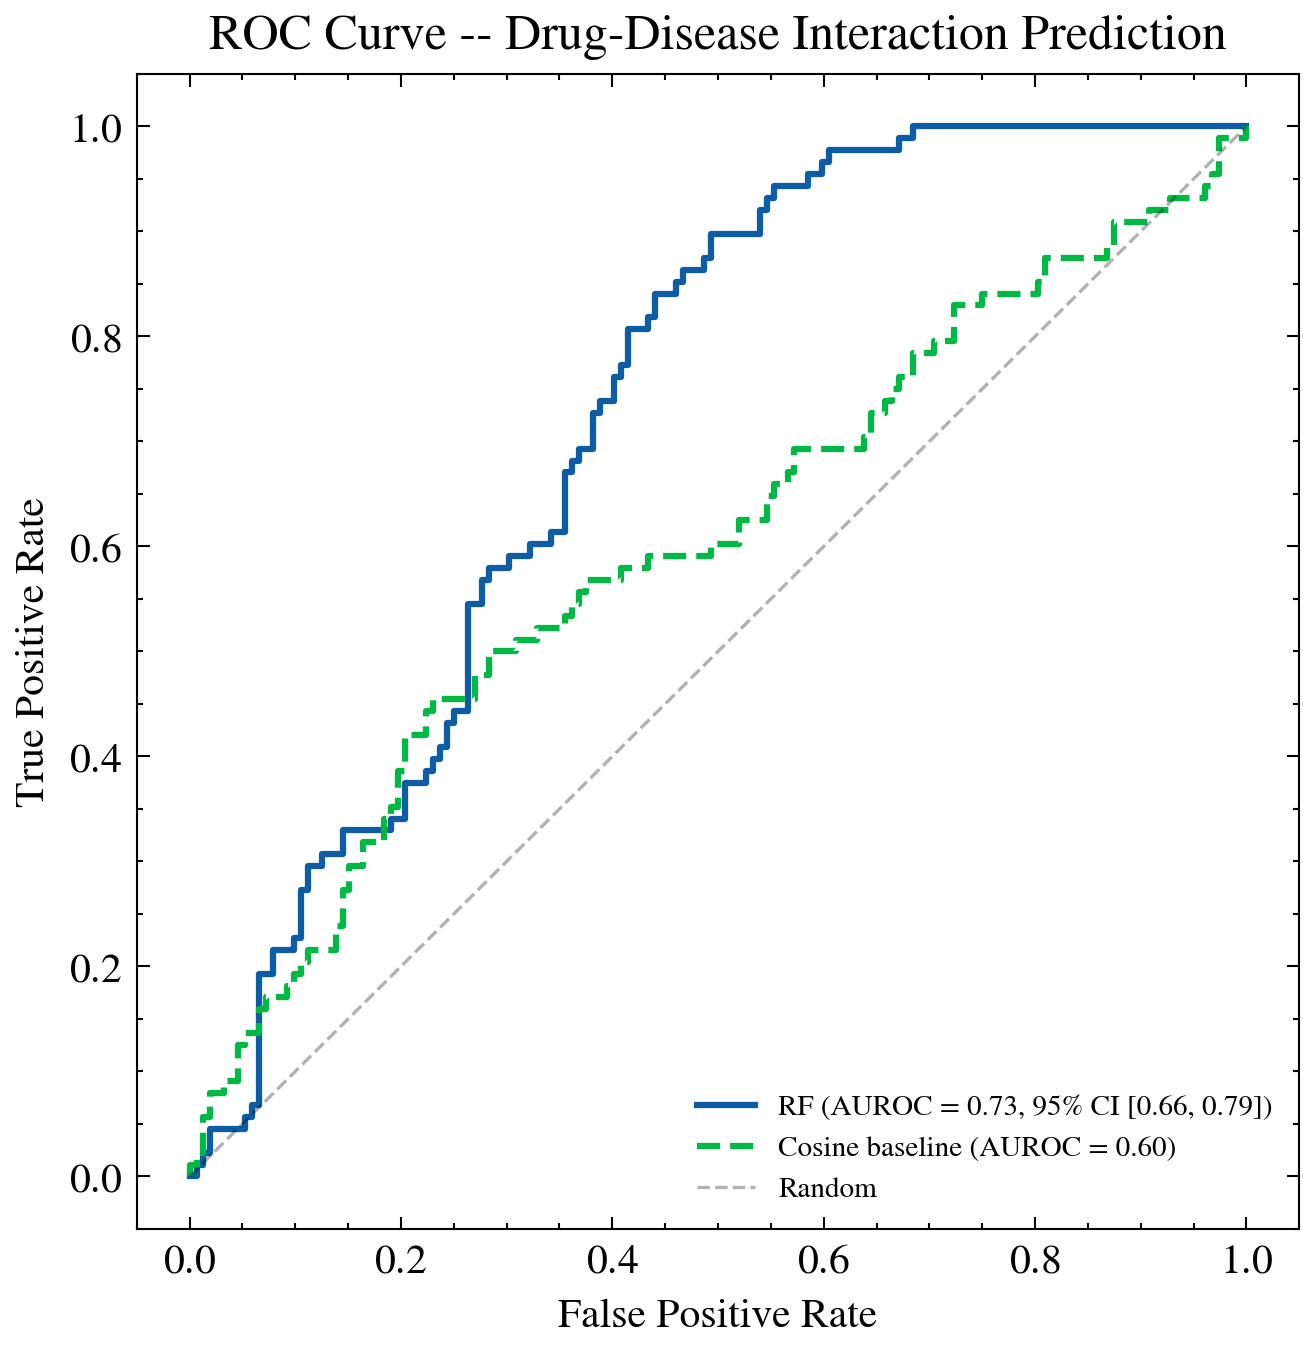
ROC curve for the Random Forest classifier predicting drug disease associations. AUROC of 0.726 under Leave One Drug Out cross validation demonstrates the gene expression similarity features carry genuine predictive signal.
AUROC 0.726 with 95% CI of 0.660 to 0.788 was measured under Leave One Drug Out cross validation. The cosine only baseline was 0.599. The 0.127 point improvement reflects what pathway enrichment features contribute on top of raw expression similarity.
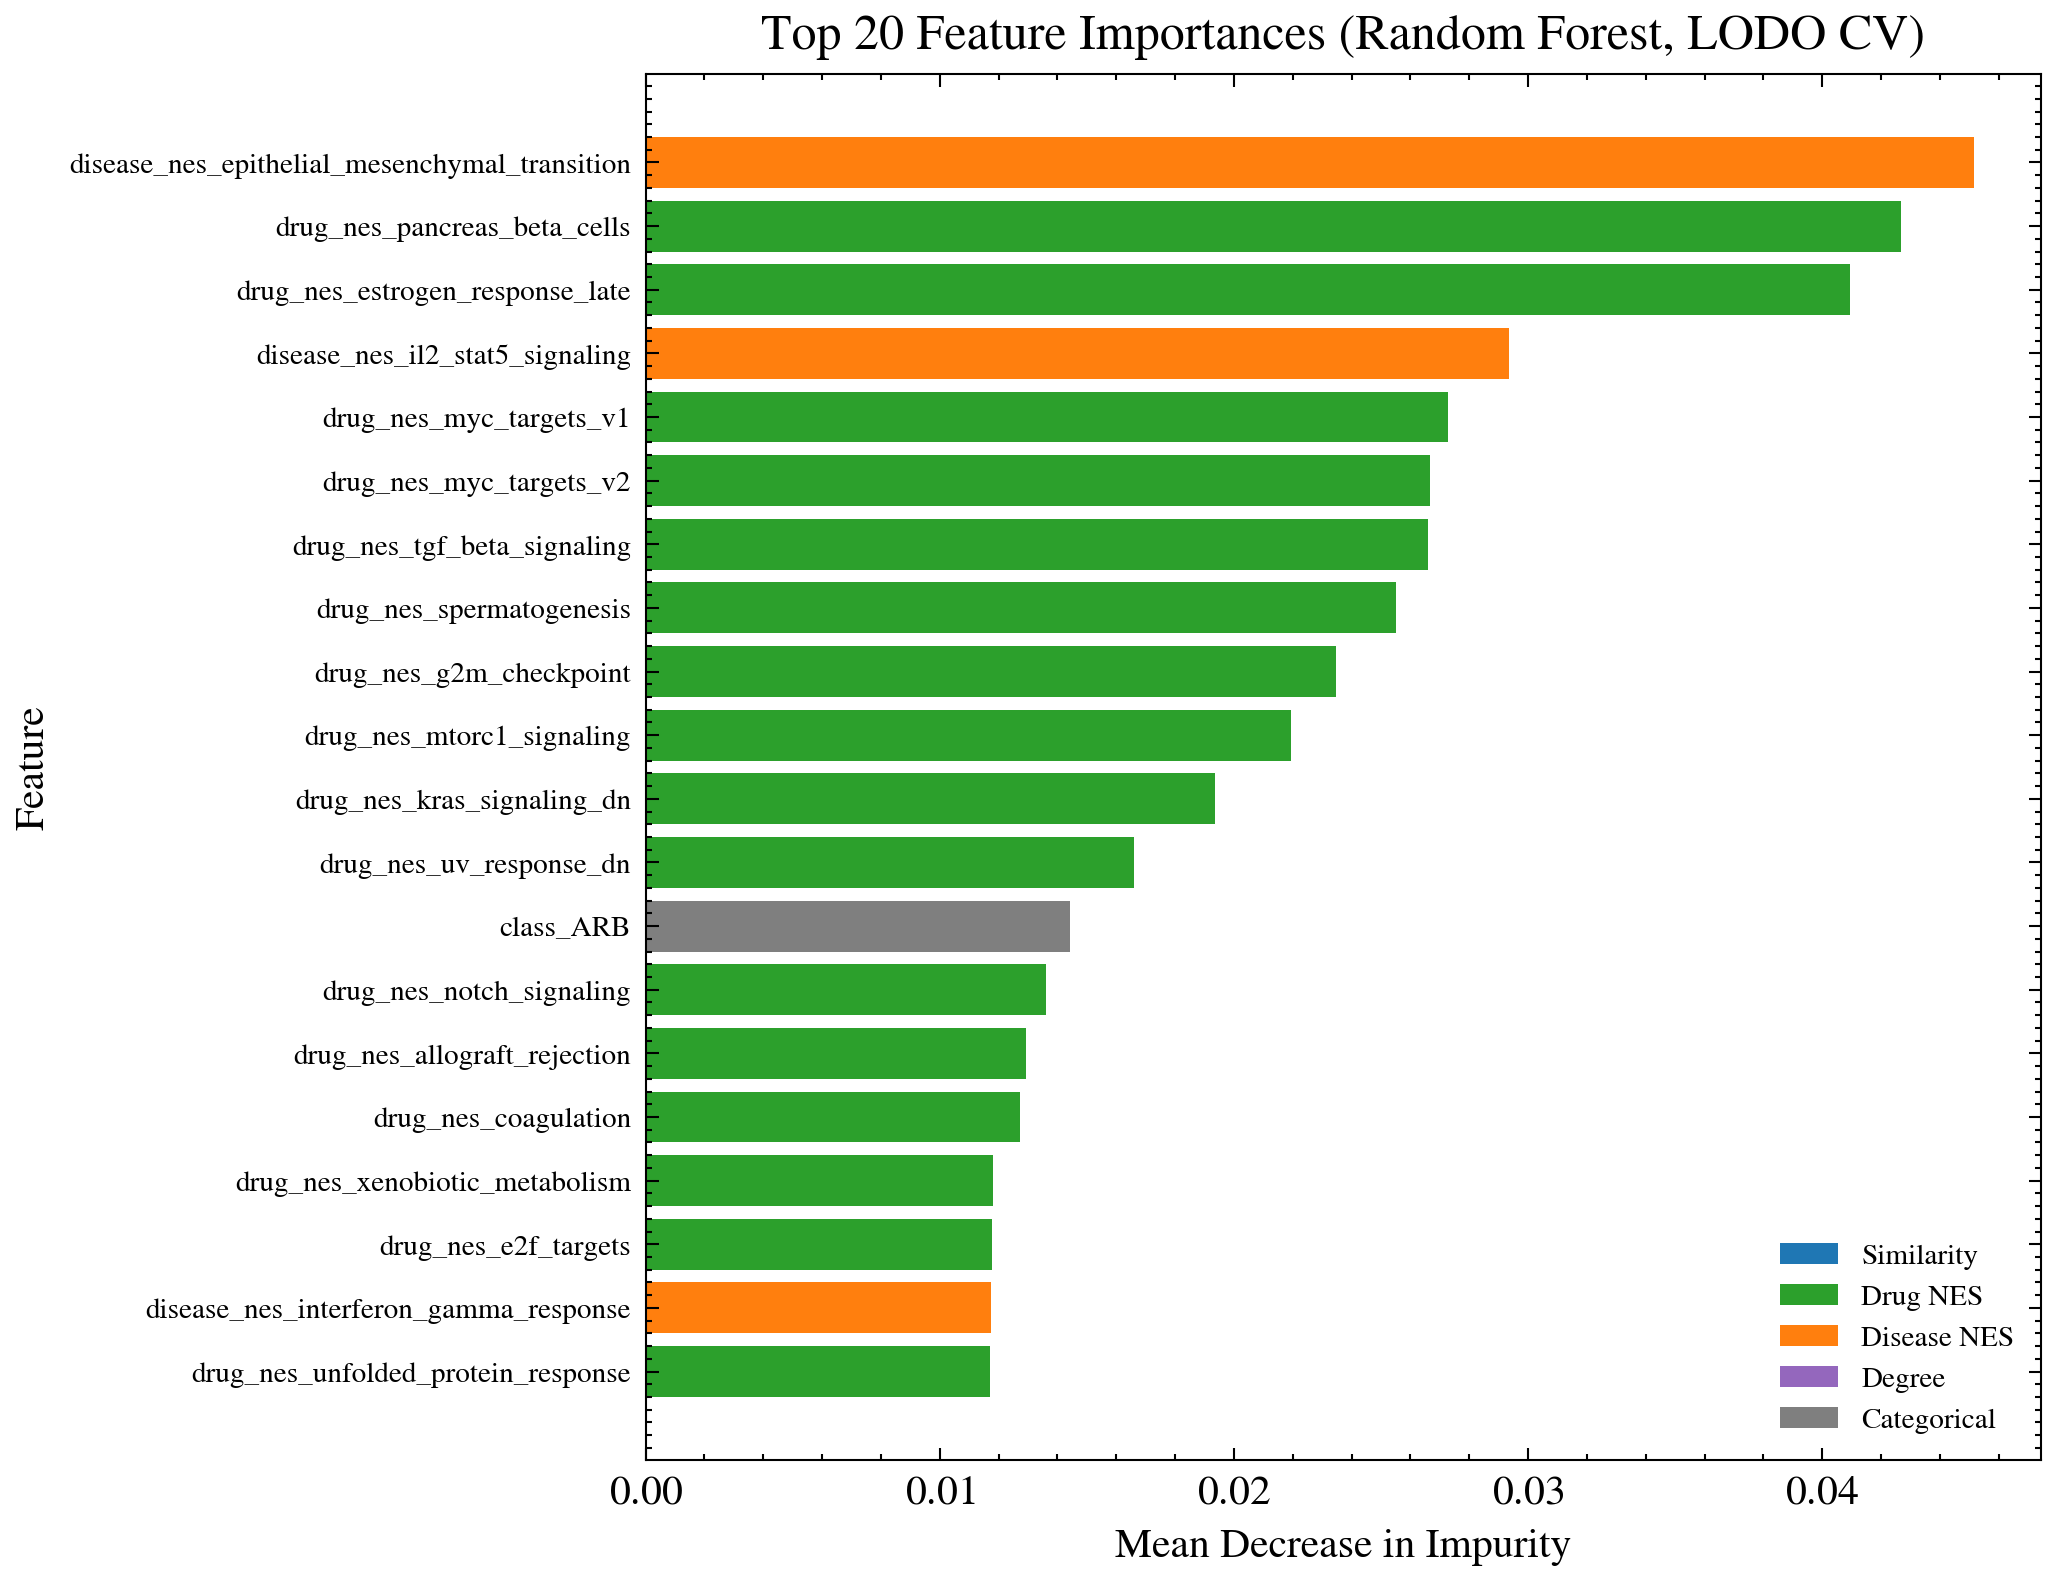
Feature importance scores from the Random Forest model. Normalized Enrichment Scores from pathway analysis outperform raw cosine similarity. Biological pathway context adds predictive value beyond similarity magnitude alone.
The top predictive features were Hallmark pathway NES scores, particularly Epithelial Mesenchymal Transition and Pancreas Beta Cells pathways. Pathway level features outperform the raw expression comparison, which justifies the three analysis pipeline. EMT appearing as a top predictive pathway is biologically interpretable since it is a process implicated in kidney fibrosis and disease progression across multiple nephropathies.
Pre vs post correction enrichment scores for Ramipril and Sparsentan against IgAN pathways. Raw scores at 1.55 were artificially inflated. After correction they dropped to approximately negative 0.044. The pipeline correctly identified and removed a preprocessing artifact.
During the IgAN analysis, raw enrichment scores for Ramipril and Sparsentan appeared remarkably high at NES values around 1.55. Cosine similarity is bounded between negative 1 and +1. A score of 1.55 is outside that range and physically impossible for a properly computed similarity. Investigation revealed the scores arose from comparing unnormalized CD signature vectors across different gene sets. After applying gene intersection normalization and batch correction, the scores dropped to approximately negative 0.044. The initial signal was a preprocessing artifact. The corrected result is honest. Catching the artifact strengthened confidence in every other result in the analysis.
The IgAN null result fits the same picture. None of the 23 drugs achieved FDR significant positive association with IgAN. Two drugs, mycophenolate mofetil and prednisolone, achieved FDR significant associations but both were discordant. The same corrections that removed the artifact also prevented false positives across the full analysis. The method declined to endorse associations it could not support statistically.
Both Ramipril and Sparsentan appeared among the top ranked drugs for IgA Nephropathy without achieving FDR significance. Computational signal aligned with clinical reality, generated entirely from gene expression patterns without any prior clinical knowledge as input.
What would be needed next is wet lab validation: testing whether these top ranked candidates actually reverse the IgAN gene expression signature in a cell model or animal system. The computational pipeline narrows the search space. The biology still has to be confirmed.
What moved, what constrained it, and what trade-offs stayed visible.
Operational outcome, the limits around it, and the practical decisions that shaped the work.
Analyzed 23 drugs across 10 kidney diseases using gene expression signature comparison. The Random Forest classifier achieved AUROC 0.726, demonstrating that CD signature cosine similarity carries genuine predictive signal. Drug class clustering emerged without supervision, validating the method's sensitivity to pharmacological relationships.
Computational similarity is a hypothesis generator. FDR significant associations require wet lab validation before clinical interpretation. The 23 drug panel was limited by GEO dataset availability. IgAN drug associations did not reach statistical significance after multiple testing correction.
FDR correction over uncorrected p values: eliminated false positives including a preprocessing artifact inflating Ramipril Sparsentan NES by about 1.5 units at the cost of reduced sensitivity. CD signatures over full gene vectors: computationally tractable and robust to noise but compresses 150 vs 150 genes losing intermediate expression context. NES features over raw cosine: higher ML predictive power but pathway enrichment adds a second layer of statistical assumptions.